 Forgiven

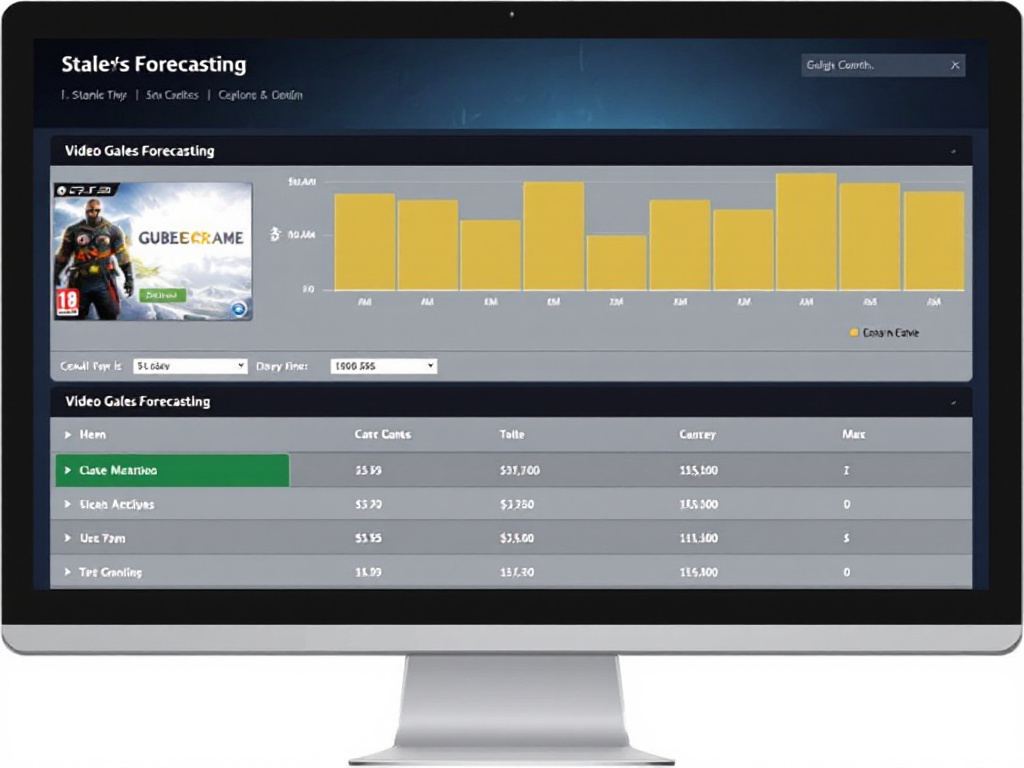
Forecasting Steam sales accurately means blending wishlist conversion data with the broader economic conditions shaping player spending in 2025 and 2026. I use global GDP trends, regional inflation figures, and interest rate movements alongside platform metrics to build realistic revenue projections for indie and mid-tier releases.
Key Takeaways
- World GDP growth is slowing from 3.2% in 2024 to around 2.9% in 2025–2026, tightening discretionary spending.
- Advanced economies grow at 1.5–2.0% while emerging markets expand 4–5%+, creating regional divergence for sales forecasts.
- Inflation has cooled to 3–4%, yet real wages in many regions still trail pre-pandemic purchasing power.
- Policy rates sitting at 3–5.5% raise borrowing costs for indie studios and shrink venture capital appetite.
- Labour markets remain tight at 3–5% unemployment, pushing developer wages up 3–5% annually.
Why Global Growth Slowdown Matters for Steam Sales Forecasts
Forecasting Steam sales starts with understanding the wider economy. World GDP growth is projected to slow from roughly 3.2% in 2024 to about 2.9% across 2025–2026, according to the IMF World Economic Outlook. Therefore, discretionary spending on games will feel the squeeze in several regions.
Advanced economies like the US, the Euro area, and Japan should grow at just 1.5–2.0% annually. Meanwhile, emerging markets such as China, India, and Southeast Asia continue expanding at 4–5%+. Consequently, I weight my sales projections differently by region rather than applying a single conversion rate.
Global public debt sits at 90–95% of world GDP, with several economies carrying debt-to-GDP ratios above 100%. Furthermore, monetary policy remains restrictive, with major central banks holding rates in the 3–5.5% range. These pressures directly shape how much players spend on premium releases.
For a stronger baseline, I recommend reading my ultimate Steam growth strategy guide before building your forecast model. It pairs well with the economic filters I describe here.

Rising Consumer Costs and Player Spending Across 8 Key Markets
Inflation surged to multi-decade highs during 2021–2022, with many advanced economies hitting 7–10%. However, by 2025–2026 headline inflation has moderated to around 3–4%. Prices still sit noticeably higher than pre-pandemic levels, which changes how players allocate their gaming budgets.
Housing, energy, food, and healthcare remain the main cost-of-living pressures. For example, US CPI fell from a 40-year high above 9% in mid-2022 to 3–4%, though core inflation stays above the Federal Reserve’s 2% target. Additionally, US unemployment sits at 3.8–4.2%, keeping wage growth steady but not spectacular.
Across the eight key markets I model, the picture varies significantly:
- United States – inflation 3–4%, mortgage rates 6–7%+, tighter premium game spending.
- Euro area – inflation eased from 8%+ to 2–3%, with wide country-level variation.
- United Kingdom – inflation peaked above 10%, base rate near 5%, growth just 0–1%.
- China – growth around 4–5%, with youth unemployment in double digits.
- India – expansion of 6–7%, driven by domestic consumption.
- Vietnam – growth of 5–7%, rising middle-class gaming spend.
- Indonesia – strong 5%+ growth and a young mobile-first audience.
- Philippines – solid growth with expanding disposable income.
Wage growth in most advanced economies sits at 3–5% but often lags peak inflation. Consequently, real purchasing power has fallen for many households, which reduces premium sell-through on Steam. Moreover, free-to-play and mobile-adjacent models often show more resilience in high-inflation regions.
When I forecast, I apply regional discount factors. For example, I trim expected conversion rates in the UK and Euro area by 10–15% during launch windows. Meanwhile, I hold or slightly raise expectations for India and Southeast Asia, where emerging market resilience supports steady growth. Pairing this with my Steam algorithm ranking factors breakdown gives a more accurate visibility-weighted forecast.
Interest Rates, Credit Access, and Funding Across 8 Development Regions
Central banks delivered the most aggressive rate-hiking cycles in decades between 2021 and 2024. Rates rose by 400–500+ basis points across major economies. Therefore, borrowing costs for studios climbed sharply, which indirectly affects release cadence and marketing budgets that drive Steam sales.
Policy rates peaked around 5–5.5% in the US, 4–4.5% in the Euro area, and above 5% in the UK. Additionally, US federal debt now exceeds £24 trillion (roughly $30 trillion), with a debt-to-GDP ratio near 120%. These fiscal pressures constrain government support for creative industries.
Higher rates have pushed US mortgage rates to 6–7%+ for 30-year loans. Consequently, household budgets absorb more housing costs, leaving less for games. For indie studios, elevated rates translate into pricier development financing and cautious venture capital deployment.
Here’s how I factor funding conditions into forecasts across eight development regions:
- United States – tight VC conditions, cautious publisher advances.
- United Kingdom – 5% base rate limits indie credit access.
- Germany – ECB rates near 4–4.5% squeeze mid-tier studios.
- France – similar Euro area pressures, though tax credits help.
- Japan – lower rates offer relative funding advantage.
- China – selective monetary easing supports high-tech sectors.
- India – variable conditions with growing investment appetite.
- Canada – rates track the US, with strong grant support.
Financial market volatility also affects publishing deals and acquisition valuations. Moreover, high-growth speculative tech ventures have been hit hardest, including many game startups. I therefore assume marketing budgets are 20–30% leaner than 2021 benchmarks when forecasting wishlist conversion.
Labour Markets, Talent Costs, and How They Shape Your Forecast
Unemployment in advanced economies sits near historic lows of 3–5%, keeping labour markets tight. US unemployment hovers between 3.8% and 4.2%. Consequently, wage growth of 3–5% per year continues to push development costs upward.
Demand for skilled talent in programming, art, design, and audio remains strong. Additionally, remote and hybrid work arrangements have widened talent pools globally. I’ve seen studios cut costs by 20–40% by hiring across Eastern Europe, Latin America, and Southeast Asia rather than only in London or California.
Sources:
International Monetary Fund – World Economic Outlook
World Bank – Global Economic Prospects
Organisation for Economic Co-operation and Development – Economic Outlook
Bank for International Settlements – Annual Reports and debt statistics
US Federal Reserve – FOMC statements, economic projections, and data releases
European Central Bank – Economic Bulletins and monetary policy decisions
Bank of England – Monetary Policy Reports
International Energy Agency – World Energy Outlook and renewable investment data
McKinsey Global Institute – reports on productivity, digital transformation, and AI
US Bureau of Labor Statistics
Eurostat
UK Office for National Statistics
National Bureau of Statistics of China


